Ranking websites for the best data extraction tools can be challenging, as there are so many to choose from with varying features. Extraction tools are used by analysts, scientists and other researchers who want to extract data sets from a large volume of information sources including databases, networks, web pages and text documents ensuring that they have only true relevant pieces.
How to Extract Data?
Data extraction is the process of extracting relevant data from a given source. For example, data extraction can be done to gather information on a particular topic or to create a web scraping script for website or blog content.
All extraction tools have similar fundamental objectives:
(1) to accurately separate data from the input source
(2) to use common techniques and keywords present in the source data.
Some of these techniques include using a controlled vocabulary, extracting all textual content, a list of all URLs in a web page or document, names of files and folders containing important information, PDFs and images containing passwords, etc.
With the increase in demands for data extraction there is a number of platforms providing data extraction service. One of the leading companies is SplashBI.
About SplashBI
SplashBI helps organizations make the very best business decisions by providing instant access to data from disparate systems in the form of reports, visualizations, & trends.
If you work with big data, SplashBI should be on your list of must-have tools. It is one of the best data extraction platforms for data analytics tools. The main benefit of using Data Extraction tools from splashBI is that they take the manual component out of the equation, which saves time and money.
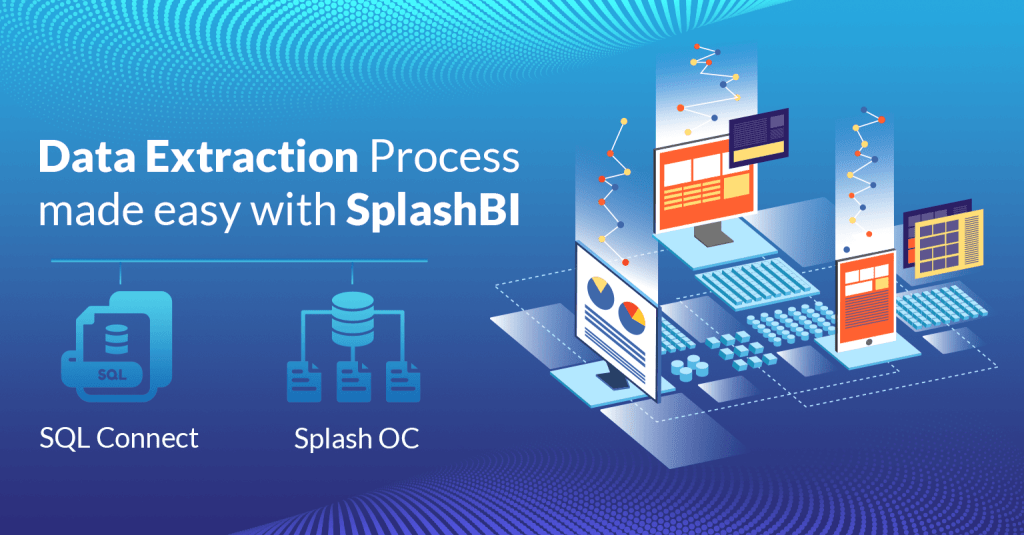
You can leverage two main SplashBi tools that will help you to analyse and extract data easily.
SQL Connect: An intelligent SQL IDE for connectivity to multiple Oracle ERP/SCM Pods and it also reduce up to 60% of your query and report development time.
Splash OC: An automated extraction Data Pipeline for Oracle Fusion ERP
Save time and effort to extract large volumes of your data by reducing IT dependency. With the help of this tool, you can also access your financial data via Excel or the BI tool of your choice.
Data Extraction Process
Writing an efficient and effective data extraction script requires planning and research. This will allow you to get the bulk of your work done quickly as well as developing efficient code afterwards.
To extract data efficiently, you should follow the following steps:
- Identify the data sources: The first step in data extraction is identifying the sources of data. This includes identifying the databases, spreadsheets, and more.
- Connect to the data sources: Once you have identified the sources of data, the next step is to connect to them. SplashBI supports a wide range of data sources, including SQL databases, NoSQL databases, spreadsheets, and cloud-based applications.
- Extract the data: The next step is to extract the data; you can use Splash Bi tools. The tool provides various options for extracting data, including SQL queries, custom scripts, and visual workflows.
- Transform the data: Once the data has been extracted, the next step is to transform it into a format that is suitable for analysis. This includes cleaning the data, removing duplicates, and transforming it into a structured format.
Data Visualization
Data visualization is a critical component of data analysis that involves the creation of graphical representations of data. The goal of data visualization is to make complex data more accessible and easier to understand. It enables users to identify trends, patterns, and insights that may not be apparent from raw data.
The first step in data visualization is to identify the data that needs to be visualized. This includes identifying the variables, metrics, and dimensions that need to be represented graphically. Choose the right visualization technique including selecting the appropriate chart or graph that best represents the data.
Choosing the visualization technique, the next step is to create the visualization using a tool by splashBI. This involves importing the data into the tool and creating the chart or graph. Once the visualization has been created, the next step is to interpret the results. This includes identifying trends, patterns, and insights that may not be apparent from raw data.
Conclusion
The main purpose of data extraction is to extract relevant data from the sources and to deliver it to the analyst. Extraction tools are available online. In SplashBI technology, you can use an advanced product which is able to extract any type of data out there. The tool also makes the extraction process more effective by making the extraction routes available in many ways.
Recently we have organized an insightful webinar to uncover the secret ways of extracting data, click and watch the video of the complete webinar to know the secret process of data extraction.
Watch Now