Choosing the Right Data Visualisation Solution: A Guide for Enterprise Decision-Makers in Saudi Arabia
According to Saudi Vision 2030, Saudi Arabia’s digital economy has reached a value of approximately $140 billion, representing 15% of the national GDP. Organisations in the Kingdom now generate massive amounts of information, more than ever, whether it is through customer relationships and financial statements or the IoT-driven devices across all sectors. Raw data, however, is required to be transformed into actionable information and generate value. With a trusted data visualisation solution, it is possible. It helps enterprises to make smarter and quicker decisions by providing complex datasets in easy-to-understand, interactive visuals.
This blog explores how to select the right data visualisation solutions in KSA to meet the business objectives and national transformation programmes.
Why Data Visualisation Matters for Enterprises in KSA
In terms of Vision 2030, digital transformation becomes the core of the national development in Saudi Arabia. Considering it, businesses that have intentions of staying competitive cannot afford to limit their operations to data storage. Instead, they start using it to make decisions. Business Intelligence (BI) tools for Data visualisation can help leaders to have dashboards with easy access to complex information and focus on growth opportunities.
In the case of government agencies or regulated industries like the financial industry, proper compliance reporting implies transparency and improved service to people. Therefore, utilising reliable data visualisation reporting tools in Saudi Arabia that reduce the possibility of error becomes necessary. Besides this, at the corporate level, high-level visualisation will enhance operational efficiency and customer experience and facilitate quicker reactions to market shifts.
Key Criteria to Look for in a Data Visualisation Platform
To ensure the best outcome, the business in KSA should make sure that the adopted data visualisation platform is both powerful and flexible. The most significant features they should look for are:
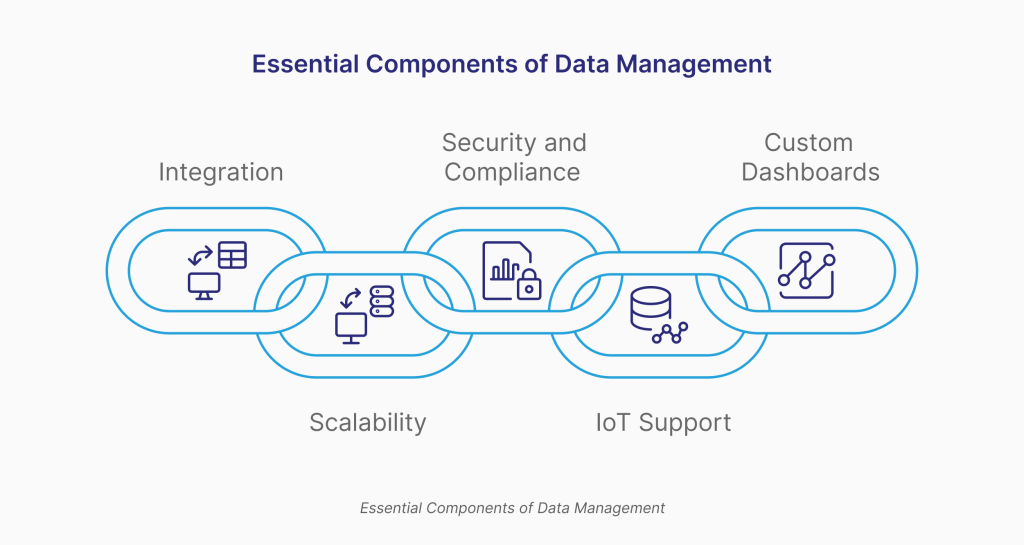
- Integration: Assured compatibility with existing enterprise systems and BI tools
- Scalability: Scalable enough to support the increased amounts of data efficiently
- Security and compliance: Strong data protection to meet the standards of Saudi Arabia
- IoT support: Ability to support an IoT data visualisation platform used to gather real-time data from connected devices in the oil and gas, healthcare, and smart cities industries
- Custom dashboards: Well-designed interfaces that enable non-technical departments to understand data easily
Data Visualisation as a Service vs. On-Premise Solutions
Whether to opt for Data visualisation as a service in KSA or go for on-premise solutions is one of the dilemmas that enterprises in Saudi Arabia face. Cloud services are scalable, have quicker upgrades and have reduced initial costs. They particularly fit well in companies that desire to change and make costs predictable.
On the contrary, on-premise deployment may be appropriate in highly regulated business sectors such as finance or defence, whereby all sensitive data must be in total control. Finally, the correct choice will be based on the business requirements, compliance, and IT infrastructure. Evaluate the balance between flexibility, cost, and control before making the final decision.
Industry Use Cases in the KSA
Data visualisation solutions in KSA are already being applied in diverse industries to unlock business value:
- Public sector: Government agencies use the advanced dashboards to promote transparency, resource management, and citizen services.
- Healthcare: IoT data visualisation solutions give hospitals and clinics insights to monitor the health of patients and the best care options.
- Oil and Gas: Real-time analytics support the safety of the operations, production, and predictive maintenance.
- Retail and Finance: BI data visualisation tools can provide a competitive edge within fast-paced markets, whether it is tailored customer experiences or fraud detection.
- Sales and Marketing: Visualise sales data, pipeline status, and customer behaviour, and monitor campaign performance, lead acquisition, conversion rates and customer segmentation to apply targeted strategies.
- Product Development: Map product Lifecycle stages, feature adoption, and progress with visualised feedback, requests, and bug reports to drive change and track innovation metrics.
These cases highlight that data-driven decision-making is currently playing a prominent role in achieving success in the Saudi economy.
Selecting the Right Data Visualisation Solutions in Saudi Arabia
When choosing a solution, enterprises should start by defining their goals – whether the mission is enhanced reporting, IoT analytics, or customer insights. The collaboration with a trusted partner like SquareOne will ensure that it holds credible experience and answers to the business environment in Saudi Arabia. SquareOne helps organisations utilise their data visualisation platform to the fullest, whether in deployment strategies or long-term support.
Final Thoughts
The enterprises in Saudi Arabia require the right data visualisation reporting tools to make them agile, competitive, and compliant. By investing in robust data visualisation solutions in KSA, organisations can capitalise on growth opportunities. Choose platforms that are capable of supporting your company’s goals and offering long-term value, and allowing you to operate clearly.
Choose SquareOne today to unlock smarter, data-driven enterprise decisions.